Smart Insights are used to generate AI-automated analysis of a given query, with the output returned in natural language. When running your Present dashboard you'll have access to Smart Insights. Smart Insights analyzes the data in a given query and renders analysis in plain text. In other words, this powerful tool takes the data in a selected visual and transforms it into plain English, pointing the user toward valuable insights about the data.
Unlike many other NLG solutions, Pyramid’s Smart Insights work on any supported data source, and is not constrained to Pyramid’s own in-memory engine.
The tool currently produces insights in English only. Other languages will be added in due course.
Note: this feature is not available in the Community Edition.
How it Works
Insights can presented in a re-sizable window beside the selected visual. They can also be accessed using the dynamic text formulations tools as part of the templated natural language options - so they can appear as paragraphs of text or in dynamic tooltips.
The user can select from 3 levels of detail: light, advanced, and categorical. Each of these levels offers a different amount of depth and different kinds of information, allowing the user to specify the level of detail required.
Depending on the given query and its selections, the tool shows a range of valuable information including average and median values and the spread of values, Pareto analysis, correlations, trends, outliers, and even forecasting.
Smart Insights are dynamic, updating in real time to reflect any manipulations or changes to the query. So, every time the user filters the query, for example, the insights are regenerated based on the current data.
Accessing Smart Insights
There are 2 ways to generate Smart Insights; you can use the integrated Smart Insights pop-up tool, or you can use the SmartInsights dynamic functions to create templated dynamic text in your presentation.
Smart Insights Pop-UP
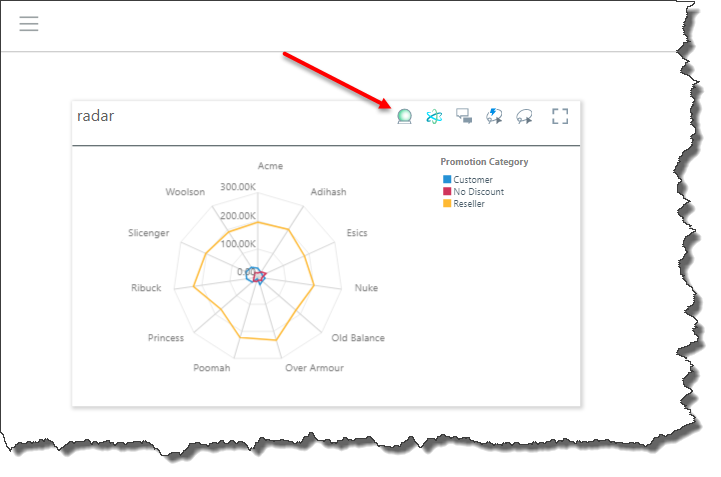
To access Smart Insights, launch your presentation in runtime. From the panel of the relevant visual, click the Smart Insights icon.
Templated Texts
You can configure dynamic text using the SmartInsights PQL functions to produce dynamic content in the presentation. This enables the display of multiple Smart Insights analyses simultaneously, across a presentation.
Navigating Smart Insights
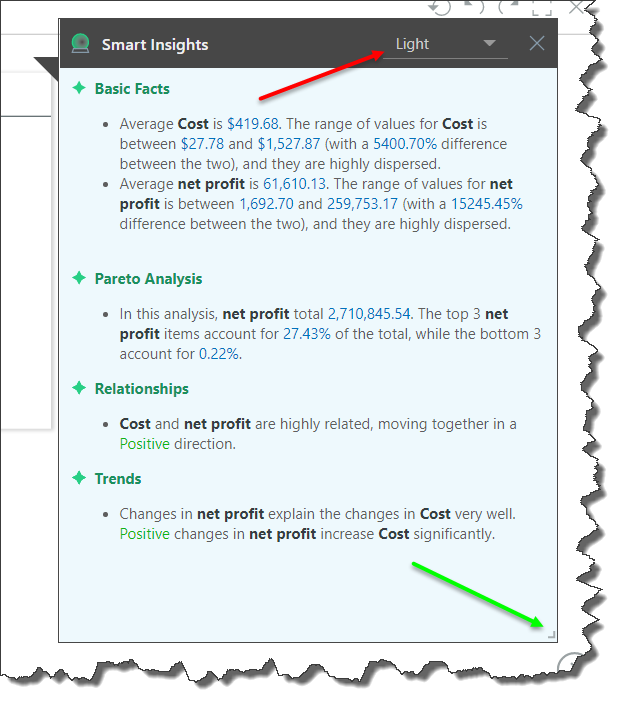
The Smart Insights window features a drop-down menu (red arrow below) from which your can select the required level of insight: light, advanced, or categorical (see below for details). The window can be re-sized from the lower right corner (green arrow).
Dynamic Insights
Smart Insights are generated dynamically, updating in real time to reflect any manipulations or interactions with the query. The types of analyses produced depend on the information in the query, like the number of measures and hierarchies, the number of elements in a hierarchy, and the presence of specialized hierarchies - like date-time.
The engine performs a variety of statistical and analytical methods to derive facts and figures about the data set. The engine then removes "noise" from the analysis, outputting a list of salient insights that the user would not ordinarily find without performing further data analysis and building formulations.
The takeaway is that any interactions with the query, like drilling, dicing, filtering, or sorting, will be reflected in the insights in real-time. Even if you interact with the query while Smart Insights is open, the insights will automatically be updated along with the query.
Example
In this screen capture below, you can see how Smart Insights is dynamically updated in real time whenever the query is manipulated.
Levels of Insight
Light
The Light analysis offers simplified metric analytics, covering measures but not categories. Depending on the amount of data in the query, Light insights may display the following information:
- Basic Facts: standard metric analysis , including the average, maximum, minimum, and dispersion.
- Pareto Analysis: shows the value's total and top n and bottom n that account for a certain percentage.
- Relationships: displays any positive or negative metric correlations and relationships.
- Trends: uses regression analysis with r-squared and slope coefficient to explain how changes to a metric affect changes to another metric.
- Forecasts: best fit forecasting (across 8 different algorithms) if the query contains a date-time hierarchy to predict whether a value will increase or decrease over a certain period and by how much.

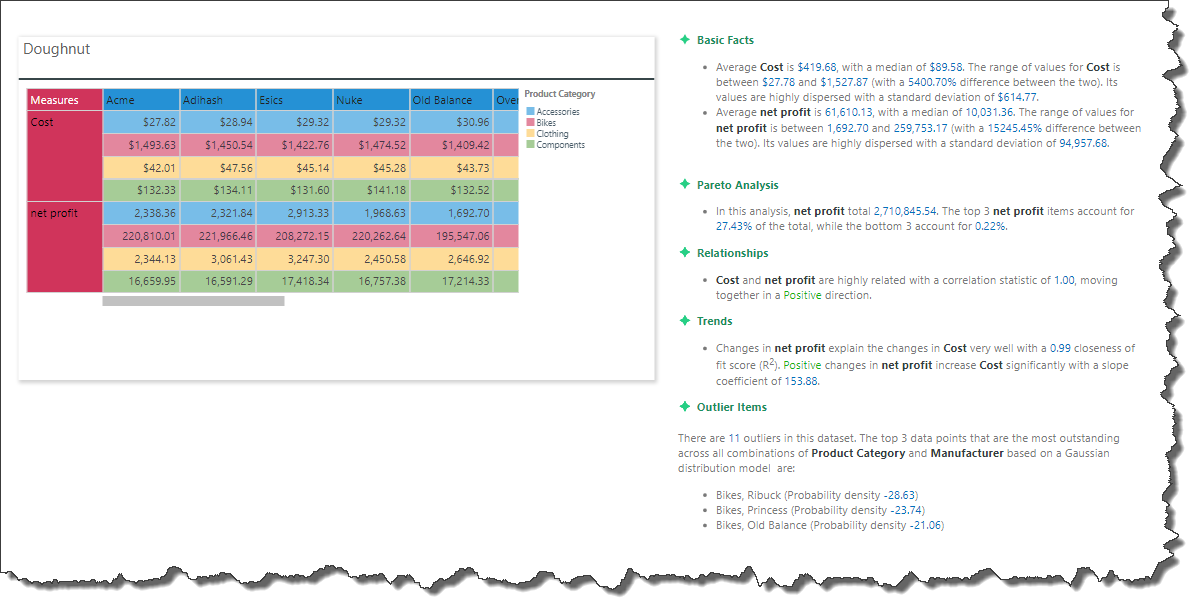
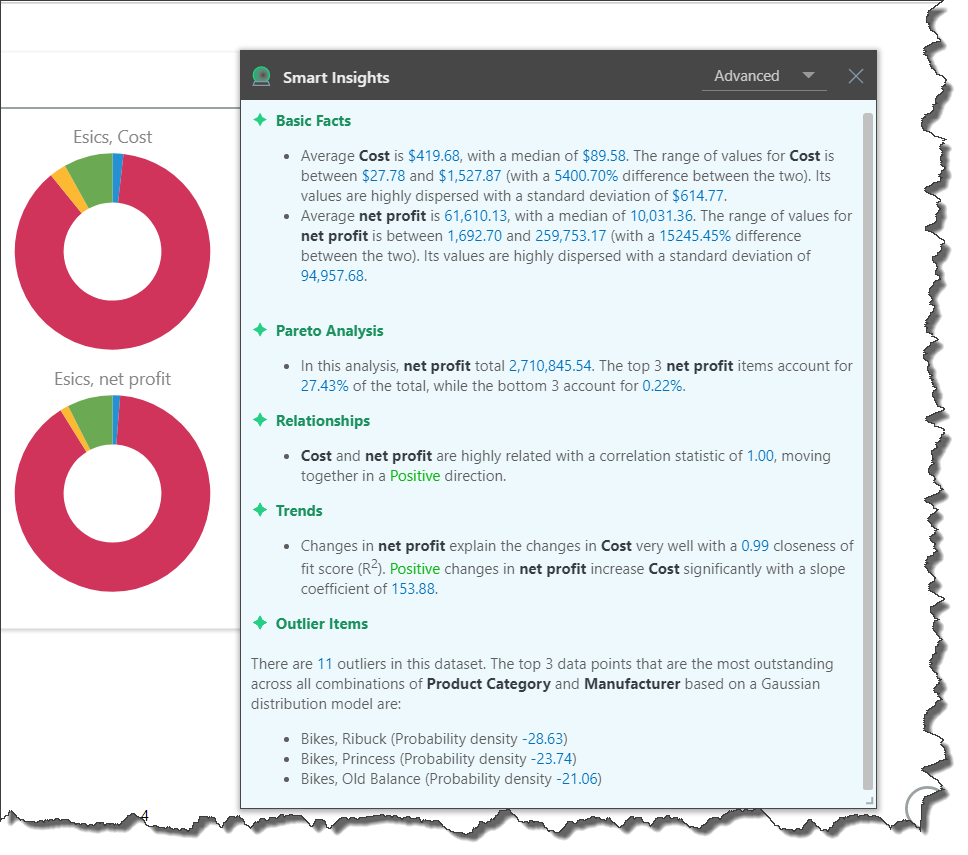
Advanced
The Advanced analysis displays more in-depth metric analytics. Depending on the amount of data in the query, Advanced insights may display the following information:
- Basic Facts: in addition to the basic facts generated by the Light analysis, this also shows the median and standard deviation.
- Pareto Analysis: same as the Light analysis.
- Relationships: like in the Light analysis, with the addition of a correlation statistic.
- Trends: like in the Light analysis, with the addition of displaying the closeness of fit score and the slope correlation.
- Forecasts: like in the Light analysis, but it also stipulates which forecasting algorithm was used, and the range of fluctuation.
- Outliers: multi-variate outlier analysis displays the top 3 most outstanding data points in the query. It also shows the probability density for each outlier.
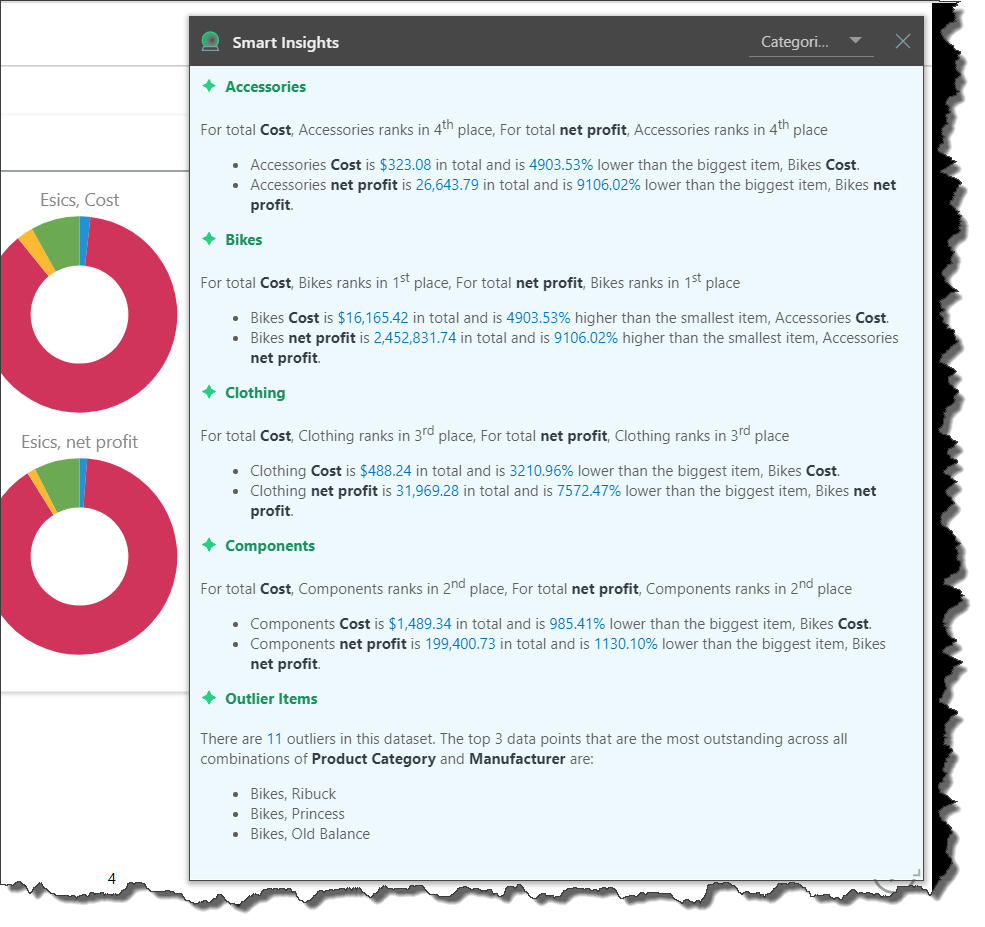
Categorical
The Categorical analysis shows simplified category/ element analytics. Depending on the amount of data in the query, Advanced insights may display the following information:
- Comparatives: compares the metrics for each category with the category that has the highest value for the same metric.
- Correlations: displays any positive or negative correlations between measures for each element where a correlation exists.
- Forecasts: best fit forecasting if the query contains a date-time hierarchy, predicting for each category whether a value will increase or decrease over a certain period and by how much.
- Outliers: A light version of the advanced analysis.